Features
Education
Research
Estimating the yield of a domestic well
A practical approach to analyzing the results of well yield testing data
April 21, 2020 By Peter Gray, P. Geo, QPESA
 Drop tube in a domestic well.
Source: Peter Gray
Drop tube in a domestic well.
Source: Peter Gray
In order to provide assistance to well technicians completing the well record for a domestic well, this article presents a practical approach for the analysis of the results of well yield testing data collected as part of the well construction activities of a domestic well.
INTRODUCTION
According to the Ontario Ministry of Environment, Conservation and Parks (MECP), there are roughly 780,000 water well records in the publicly available digital water well record database. This source of “big data” contains information about the location, type of well, depth, construction materials/drilling method, geologic materials encountered, driller’s (well contractor and technician) name, water quality, response to pumping and estimated yield of the individual well that is recorded. Water well records date back to the early 1900s and over the past 100 years, the information contained in the water well records has varied considerably, for various reasons. For example, due to more recent privacy policies, well owner names are no longer made available to the public. Another reason is related to the level of experience, expertise and training received by the well technician over their career.
The content for this paper comes from a course for Certified Well Technicians offered by Fleming College referred to as Continuing Education Course GEOL 69, Well Logging and Testing Fundamentals, and presents two methods to assist well technicians when completing the boxes in the Well Record form relating to the Recommended pump rate and Well Production sections.
BACKGROUND
Ontario Regulation 903, otherwise referred to as R.R.O. 1990, Regulation 903 (Wells Regulation) as amended made under the Ontario Water Resources Act, R.S.O. 1990, c. O. 40 (Wells Regulation) establishes the minimum construction (including abandonment) requirements and outlines the licensing requirements, conditions and the roles and responsibilities required of licensed well contractors, well technicians and well owners in complying with the regulation in Ontario.
One specific requirement of the well technician is the completion of a two-hour pumping test on the well, which includes one hour of pumping at a constant rate while measuring and recording water levels in the well at a prescribed rate, followed by one hour of non-pumping, or recovery, while measuring and recording the water levels as the well recovers from the stress imposed on it by pumping. As shown in Table 1, space is provided on the Well Record form for this drawdown and recovery data.
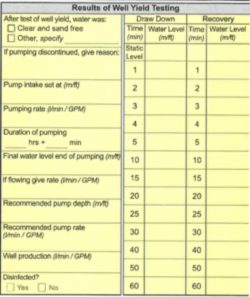
Table 1: Well Yield Testing Table from Water Well Record.
WELL YIELD TEST
According to the Wells Regulation, the well must be pumped for a minimum period of one hour using a pump that has been installed in the well, while maintaining a constant pumping rate. This activity can be performed by a Class 1 or 4 Licensed Well Technician. The constant rate can be regulated in a number of ways, from measuring and timing a specific volume of the pumped ground water into a pail, to using an in-line flow meter. The main point is that the pumping rate remains constant throughout the well yield test.
Water levels are most accurately measured in the well using an electronic water level meter / tape, or datalogger lowered inside of a temporarily installed one-inch (1”) or two-inch (2”) PVC tube with a slotted well screen at its base, referred to as a “drop tube.” The drop tube, as shown in the photo, typically terminates at a depth lower than the depth that the water will be drawn down, which is commonly close to the top of the pump. The drop tube helps ensure that the electronic water level tape or datalogger doesn’t get caught up in the wires for the submersible pump, or set off from water cascading into the well in open bedrock holes. The water pumped from the well must be discharged far enough away from the well so as to not cause recirculation back into the well and thereby influence the pumping and recovery water levels.
DATA ANALYSIS
Recovery Data
Both the pumping, or drawdown water levels, and recovery water levels reveal critical information about the operation of the well. One key outcome of the pumping test is to determine if the well recovers after one hour to within roughly 95 per cent of the drawdown measured after pumping for one hour. If the amount of drawdown is roughly equal to the amount of recovery, then the data collected is representative of the aquifer conditions surrounding the well and the data can be used to confidently estimate the well yield.
If the recovery rate or amount is not close to the drawdown rate or amount, then there are either well- or aquifer-related factors that will result in an incorrect well yield estimation. This discrepancy is more often the case in bedrock aquifers, where the water pumped comes from storage of the ground water in cracks, or fractures or weathered bedding planes in the bedrock. Once these features in the bedrock that store and transmit the ground water are drained, they can take a long time to refill/recharge, resulting in low recovery rates. In this case, the pumping data collected will result in an overestimation of the yield of the well.
Pumping – Drawdown Data
To analyze the drawdown data, a review of some well terms is helpful, as shown in Drawing 1 Well Schematic.
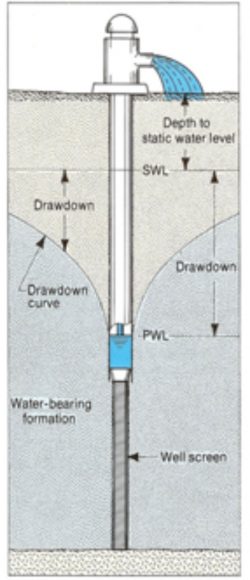
Drawing 1: Well Schematic.
Source: F.G. Driscoll, Groundwater and Wells, 1986, Johnson Screens
- Static level (SWL) − The level attained by water at equilibrium in a well when no water is being taken from the well
- Pumping level (PWL) − Water level in a well while water is being taken from the well
- Drawdown (DD) − Difference between the static water level and the pumping water level
- Available Drawdown − Difference between the static water level and the maximum level the water can be safely drawn down during pumping, also referred to as the pumping level
Specific Capacity (SC) Estimation Method 1
Specific capacity is a term used to describe the amount of water a well delivers when pumped, per unit measure of drawdown.
The formula for Specific Capacity is: SC = pumping rate (in gpm or L/min) / drawdown (in ft or m), so the units are represented in gpm/ft or L/min/m drawdown.
The pumping rate is determined by the well technician, and it is the rate that the well was pumped for the one-hour period. The drawdown is the amount of drawdown measured by the well technician after the one-hour period. To calculate the SC, a case study is provided:
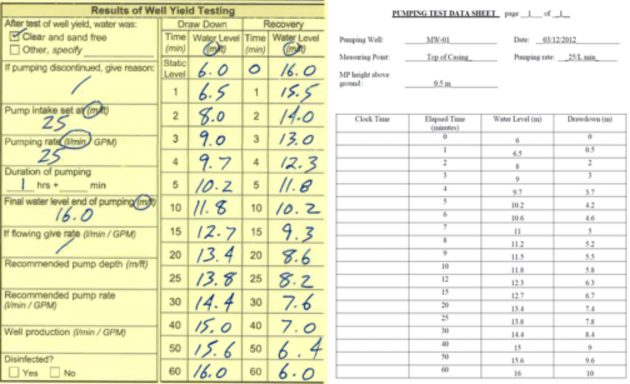
Table 2: Case Study Data.
Source: Continuing Education Course GEOL 69, Well Logging and Testing Fundamentals, Fleming College
As shown above, the specific capacity (SC) for the well = pumping rate / drawdown = 25 L/min/10 m = 2.5 L/min/m. This demonstrates that for every metre(m) of drawdown, the well produces 2.5 L/min.
This information can then be used to determine the Well Production rate to insert into Table 2 = available drawdown x SC. The Well Production rate is the rate determined by the technician to represent the maximum rate at which the well can be pumped.
The available drawdown, as noted above and shown on Drawing 1, is the difference between the water level at the maximum amount of drawdown and the static water level. In the Specific Capacity case study, the pump intake is set at 25 m. For safety purposes (i.e., enough water to cool the pump), the technician wants to maintain at least 1 m of water in the well above the pump, so the available drawdown = 24m – 6m = 18m.
To calculate the Well Production rate = available drawdown x SC = 18 m x 2.5 L/min/m = 45 L/min.
The Recommended pump rate for the Table 2: Study Case Data could also be 45 L/min, or something less depending on the well technician’s knowledge of the well and how it performed during pumping and development, but nothing more or else more drawdown will occur. In some cases, the well technician builds in a safety factor when recommending a pumping rate, such as 0.75, in order to account for changes in the aquifer or well condition, which would result in a recommended pumping rate of 45 L/min x 0.75 = 34 L/min for this case study.
Projecting Drawdown Data Method 2
Using the data from the pumping test, the amount of drawdown is calculated for each water level measurement, as shown in Table 2. This data can then be plotted on semi-log graph paper as shown in Graph 1 below.
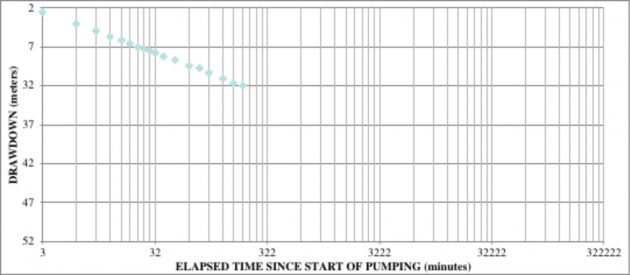
Graph 1: Drawdown data from case study for 60 minutes of pumping.
Source: Continuing Education Course GEOL 69, Well Logging and Testing Fundamentals, Fleming College
Graph 1 above shows that 10 m of drawdown was measured after 60 min of pumping. Since the well has 18 m of available drawdown, can the well produce more than the 25 L/min that it was pumped at?
If a straight line was drawn through the data to project the drawdown to 1 day (1440 min), which would simulate the well pumping at the same rate for 24 hours, as shown on Graph 2 Projected Drawdown below, then the resulting drawdown would be 17 m. This method does not account for any changes in the well or aquifer conditions during the 24-hour period.
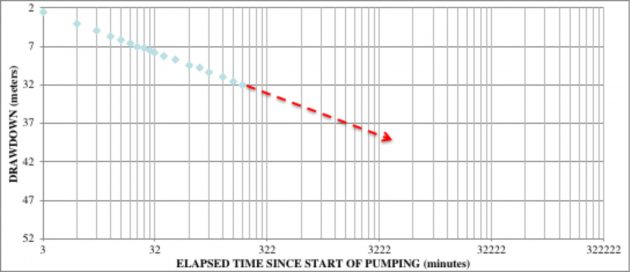
Graph 2: Projected Drawdown of 17 m after 1 Day of Pumping (1440 minutes) at 25 L/min.
Source: Continuing Education Course GEOL 69, Well Logging and Testing Fundamentals, Fleming College
This method predicts that the well can be pumped at 25 L/min for 24 hours with a resulting drawdown of 17 m, which is less than the 18 m of available drawdown and maintains 1 m of water in the well above the pump for pump-cooling purposes. If, for another example, the well had 35 m of available drawdown, then this example shows that only 50 per cent of the available drawdown was used, and a higher pumping rate could be recommended by the well technician. However, in this case the well technician could safely conclude 25 L/min for both the Well Production rate and the Recommended pump rate.
SUMMARY
Ontario Regulation 903, otherwise referred to as the Wells Regulation under the Ontario Water Resources Act, sets out the minimum requirements for licensed well contractors and well technicians when performing a well yield test on a domestic well. This article has examined two approaches to assist the well technician when completing the section entitled Results of Well Yield Testing by specifically outlining two approaches to complete the boxes related to the Recommended pump rate and Well Production sections in the Water Well Record form.
The water level data collected from pumping the well for one hour at a constant rate and measuring the well recovery for the following one-hour period, provides valuable information about the performance of the well and the aquifer that it is constructed in. If the amount of drawdown measured after pumping the well for one hour at a constant rate is roughly equal to the amount of recovery measured after one hour, then the drawdown data can reliably be used to calculate and recommend a pumping rate and production rate for the well tested by using either the Specific Capacity method or the Extended Drawdown method.
Peter Gray is vice-president and senior hydrogeologist of MTE Consultants Inc., in Kitchener, Ont. He is a licensed well contractor #C-7302, and an instructor of Continuing Education for Fleming College.
Print this page