Features
Business
Drilling down: Industry snapshot
Results of Ground Water Canada’s first survey offer overview of the groundwater industry in Canada
September 24, 2020 By Colleen Cross
 ICONS: © Adobe stock, ILLUSTRATION BY ALISON KEBA
 We asked nosey questions and you answered. The results of Ground Water Canada’s first Ground Water Professionals Survey are in.
To everyone who responded openly and constructively, thank you for your feedback. As you’ll see below, it is giving us all a bird’s eye view of your work, helping us better understand your daily challenges and pointing the way forward for the industry.
The survey, co-sponsored with the Canadian National Ground Water Association and the Ontario Ground Water Association, gathered information and opinions from 94 participants, including water-well contractors who are owner or partner in their business, pump contractors who are owner or partner in their business, and engineers and scientists with professional designations. Some used the “other” category to describe their role in the industry: water operators no longer certified to install, association staff, owners of pump and water treatment businesses, government groundwater technologists, water line locators and retired groundwater consultants and manufacturers/suppliers to the industry.
Who are you?
31% of respondents described their business as pump installation and servicing, while 25% said they were engaged in water-well drilling and servicing. 20% do professional consulting, 17% list “other” responses, including well head and pump installation and servicing, filtration sales and service, aquifer testing, pump distribution, manufacturer, consulting/supply/commissioning and wholesale business. 4% do geothermal drilling and servicing and 3% do geotechnical drilling and servicing.
RATES
Drilling rates have often been a source of frustration, with price undercutting all too often creating bidding wars among contractors for jobs.
We asked you to compare your current drilling rates to those your operation was paid in 2015. Answers suggest monitoring of prices over time may not be a priority for some. 29% of survey participants said their rates have increased by more than 10%. One-fifth (21%) weren’t sure. 18% said their rates have increased by 3-5%.
WORKLOAD
It’s no surprise that people in this industry are a hardworking bunch. 82% of you work 12 months of the year. Those who don’t work year-round, work an average of seven months of the year. Many of you – just over half of participants – work 31-50 hours per week. 34% push the envelope at 51-70 hours. A few (8%) report working a whopping 71-90 hours per week and one person clocked in at 110 hours (we appreciate you taking the time to fill out the survey)!
Most businesses (83%) reported working 41 or more weeks of the year. Just under 10% work 31-40 weeks. About 7% work 21-30 weeks.
Almost half of you (45%) work more than 55 hours per week. About one-quarter of you (24%) work 46-50 hours per week. 13% fall somewhere in between with 51-55 hours per week. 5% work 41-45 hours per week, 7% work 35-40 and 4% work less than 35 hours due to, among other reasons, semi-retirement.
OPERATIONS
Participants hailed from Ontario (41%), Alberta (20%) and British Columbia (14%). A smattering of participants were from each of Saskatchewan, Manitoba, Quebec, New Brunswick, Nova Scotia and Prince Edward Island.
The average number of business locations was two, suggesting many of you operate from one location. A couple of responses, giving a nod to growth and/or consolidation listed five locations.
When asked what activities their business is involved in, the most frequent answers were pump installation (65%), flow testing (62%), pump sizing (62%), well decommissioning (60%), water-well maintenance and repair (54%), pump sales (54%), water-well inspections (53%), installation of pressure tanks (53%), well rehabilitation (53%) and water-well inspections (52%).
Many of you do equipment upgrades and replacement (49%), pump system rehabilitation (49%), water system design (47%), water treatment (45%), well upgrades/alteration, water filtration (42%), new industrial water-well construction (38%), installation of controls, including variable frequency drives (38%), down-hole camera inspections, waterline trenching and installation (36%), new agricultural water-well construction (34%), new monitoring water-well construction (33%), electrical installation (pumping system to disconnect), new municipal water-well construction (31%) and water-well remediation (31%). Direct push and hydrogeologic analysis were among activities mentioned that were not in the survey options.
We asked drillers to share their preferred methods. Air rotary led the pack (41%). Mud rotary came in second at 24%. Cable-tool and auger drilling each got 16% of the responses. Then sonic (10%) and diamond (6%). Choices were rounded out with directional drilling, jetting, digging and boring (with 4% each) and hand-driving (two%).

Drilling is a specialized and rather solitary business, so it’s no surprise that more than half of businesses employ a team of less than five people and 4% are a one-driller show. Quite a number (21%) have teams of 10 or less.
For drilling contractors, between 50 and 100 new wells drilled per year was the sweet spot for many (34%).
When it comes to office work, almost all (98%) use a professional accountant, 33% use a professional bookkeeper and a professional tax service. Under “other” some of you specified family, Canadian Federation of Independent Business, bookkeeping/advertising done in house and legal counsel.
PROFIT
21% reported an average annual gross revenue of $251,000-$500,000. An equal percentage were in the next bracket of $501,000-$1,000,000. 20% came in at $1,000,000-$2,000,000. About 15% reported gross revenue of under $100,000. An average of 53% of this figure is from well work only.
We asked participants to put pencil to paper to estimate their 2019 profit margin. What did they bank, measured as per cent, or, expressed another way, profit before income tax divided by total revenue. For example, $5,000 of profit on $100,000 of revenue = 5% profit margin. Encouragingly, 22% of you estimated 2019 profits at 11-15%. 18% of you made three to 5% in profits. 16% of you pulled in a healthy 20%-plus in profits. About 14% were in the 6-10% bracket.
On the down side, 6% reported bringing in one to 2% profit, operating at a loss or being unsure about profits.
Quite a few of you (64%) found your profits fell in a similar range to the two previous years. For 6% profits were slightly higher. For 14% they were slightly lower.
What profit should you be making? More than half of you thought a fair profit range for an established, productive contractor was 16-20%. 22% felt 11-15% was fair. All agreed less than 3% was not a fair margin for work done. A small group (5%) aspired to 30-40% profit.
But fair and acceptable are two different things. To gauge satisfaction, we asked, “Are you able to make the profit you wish to make and pay your employees enough?” 76% of you answered yes.
A slight majority (55%) said pay rate and benefits are an obstacle to keeping employees. “In an oilfield-based economy everyone with a pulse thinks they deserve $40/hr,” one respondent commented. “We tend not to hire people with a lot of oilfield experience on their resumé.”
WAGES
Just over half who earn an hourly wage listed their average pay rate, excluding benefits, as $30/hour, while 20% pegged it at $16-20/hour and another 20% pegged it at $21-25/hour.
Owners reported average driller pay rates (benefits excluded) at $26-30/hour for 36% of you. However, a number of you (23%) reported paying rates of $21-$25/hour and an equal number reported paying more than $30/hour. 14% reported paying $16-$20/hour. Driller helper rates averaged $24/hour.
Average pump installer pay rates (benefits excluded) came in at $21-25/hour for 40% of you. However, a number of you (33%) reported paying rates of $26-30/hour. 21% reported paying more than $30/hour. Pump installer helper rates averaged $22/hour.
Among non-owners who participated, 81% receive paid sick/personal days. 78% have dental insurance coverage. 70% of employees have life insurance coverage. 67% receive paid vacation days beyond the legal minimum. 63% get additional medical/prescription coverage and another 63% receive vision coverage. 41% have their pension plans matched by their employer. 11% are included in profit sharing. Another 11% listed other benefits such as belonging to a union, working on contract and disability insurance.
OPERATOR COSTS
Looking at how costs have changed in the past three years, participants were asked to rate each of several costs using a scale from significantly lower, to significantly higher.
Significantly higher were machinery purchase costs (38%), machinery parts and service costs (45%), material costs for resale (for example, well casing) (43%), fuel (25%) and insurance (19%).
Significantly lower were machinery parts and service, material costs for resale (for example, well casing) (14%), labour, workers compensation rates (9%), fuel (6%), insurance (6%) and finance (14%).
CHALLENGES
Which challenges stand out over the next three years? Each challenge was rated as not overly important, fairly important or very important. Rated as very important in order of weight:
- Overall health of the Canadian ground water industry (65%)
- Ability to attract and retain employees (62%) – we’ll study this challenge in depth in 2021
- Cost of insurance (53%)
- Cost of fuel (45%)
- Ability to maintain or improve the productivity of my operation (42%)
- Cost of machinery (40%)
- Access to financing (37%)
- Ability to attract buyers for my business (25%)
Several challenges not included as choices in the survey were pointed out by participants: succession planning for retirement, flawed groundwater legislation, the ability to charge a fair price for services without having a bidding war with other contractors that do not realize they are giving their work away, capitalizing on having perceived water quality advantage over city tap water, raising awareness of the need for industry improvement and drilling restrictions in water-short areas.
SUCCESSION
Although not everyone revealed their age, 55% of non-owners were over 50 years old and nearly 20% were between 25 and 40 years old.
A quarter of you planned to continue in the industry for another six to 10 years. Almost as many (23%) planned to be in business for more than 20 more years. 21% were looking to leave the industry within five years.
Well over one-third (36%) of you expect some or all of your children to assume control of your business. Some expect to sell to another contractor (14%). A few (7%) have managers interested in or planning to take over and another 7% will sell/auction my equipment and shut down when they retire. A full one-third (33%) do not currently have a succession plan. Read “Succession planning” starting on page20 of this edition for an in-depth look at how some contractors are handling the transition and advice from experts on how to do succession planning well.
27% of participants said they have children currently working in the operation who will likely take over. 20% are unlikely to be involved and/or acquire the operation. As one respondent said, “They are into other pursuits.” 18% said their children are too young to be involved, but they hope they do so one day. A few have children currently working in the operation but with no plans for them to acquire it. 14% said they have no interest in their children getting involved in this business.
NATIONAL ASSOCIATION
Participants were asked what role the Canadian National Ground Water Association (CNGWA) should play in the groundwater industry. They could list as many priorities as they saw fit. Nearly three-quarters felt the CNGWA should advocate for the industry and present a united voice to the federal government. Almost 60% wanted to share information among members. More than half (53%) wanted making intergovernmental regulations on groundwater a priority. Just over half wanted to see sharing of groundwater data/well records and science federally and among provinces. 46% were in favour of networking with other associations and the same percentage wanted to see the association provide elite driller/pump installer certification across Canada. 34% wanted to focus on Canada only, while 22% wanted also to focus on the United States. 38% wanted to have a say in where funds are allocated for groundwater and the industry. 32% said they are interested in networking with other business and industries.
Some participants identified other priorities, including certification, assisting provincial governments with developing functional legislation, establishing a standardized code for drillers and pump installers and providing leadership in groundwater management. One thoughtful respondent said, “I think one thing of value is to work with the provinces and federal government to recognize drilling and pump installation as Red Seal trades. Another is developing and delivering drilling/pumper education.”
THE FUTURE
We asked where opportunities for contractors lie to improve operations and/or profitability. The top response was clients putting more value on your services to allow higher prices (73%). Next were improved professionalism in the eyes of the client (66%) and improved co-operation between government and contractors (54%). Half of participants see opportunities in new technology (51%). 46% see increased efficiencies on the operations side as a path to better operations and/or profitability.
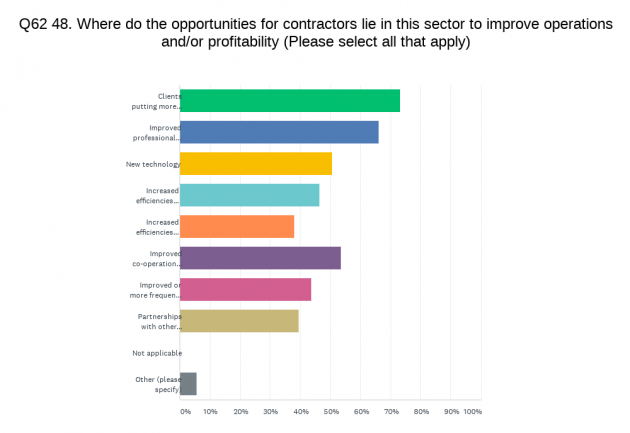
Improved or more frequent training (44%), partnerships with other associations relating to water (39%) and increased efficiencies on the business management side (38%) all were seen as opportunities for improvement. Other opportunities were identified include “Other training not related to Reg 903”, “Develop proper trades training to provide better pathways to employment and raise the standards of practice”, “Having higher standards of certified product” and “Communicating to public/regulators on the value of groundwater.”
Although the survey sampling was relatively small, we learned much from our first survey, including the need to dive into the scientific side of groundwater as well as the business side. We will improve and update the survey periodically to better understand the industry’s needs. We urge you to participate in our next survey and be part of a conversation that needs to happen to ensure a healthy future.
The survey was conducted in June and extended to gain as much input as possible. Winners of the prize draw for two Visa gift cards worth $200 each are Donald V. Weir and Tom Burke. A complete 2020 Ground Water Professionals Survey summary report will be emailed to participants who provided their contact information. Thank you to our sponsors, the Ontario Ground Water Association and the Canadian Ground Water Association, who helped make this project possible.
What motivates people to work in this industry? Here are a few popular factors:
- 64% – The variety and challenge of the role
- 63% – The people (co-workers) I get to work with
- 61% – My independence
- 57% – The clients (well owners) I get to work for
- 39% – Ability to work outdoors
- 35% – Financial compensation
- 23% – Ability to provide local employment
- 16% – Continuation of family tradition
Print this page