Features
Water Issues
Our changing groundwater
Climate change is bringing both surface and groundwater levels to centre stage in Canada
January 17, 2022 By Treena Hein
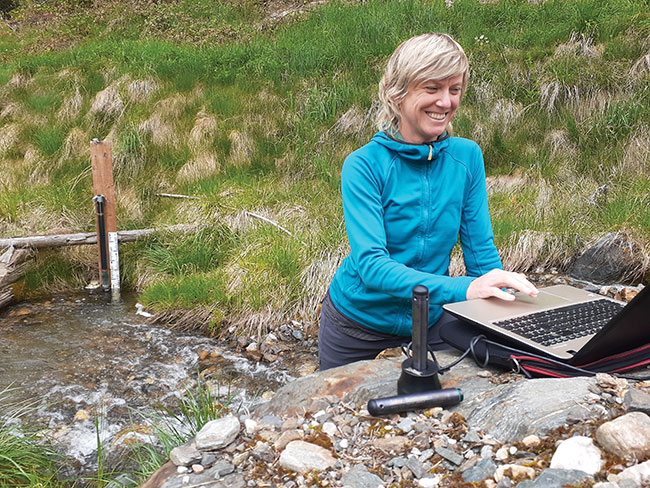 Some provinces such as B.C., Alberta and Ontario monitor streams and river levels. In Ontario, a collaborative network of seven “Integrated Climate Change” monitoring stations exist across the province, which measure weather parameters, and the level and quality of water in streams and groundwater.
Photo credit: Living Lakes Canada.
Some provinces such as B.C., Alberta and Ontario monitor streams and river levels. In Ontario, a collaborative network of seven “Integrated Climate Change” monitoring stations exist across the province, which measure weather parameters, and the level and quality of water in streams and groundwater.
Photo credit: Living Lakes Canada. During 2021, the Canadian Prairies experienced severe drought, and many people both there and across the country were very concerned. The severe flooding in British Columbia in November also shocked Canadians from coast to coast.
It’s safe to say that climate change is bringing both surface and groundwater levels to centre stage in Canada.
Groundwater (GW) levels are obviously sensitive to precipitation, but they’re also affected by aquifer storage capacity, recharge rate (the rate at which surface water trickles down to aquifers) and human withdrawal.
As we did in 2013, we now present a cross-country GW snapshot, along with a look at trends and the newest monitoring technologies. Keep in mind that GW levels fluctuate yearly and long-term trends are hard to discern in many regions. Some provincial agencies can speak to trends more than others.
British Columbia
The B.C. Ministry of the Environment has operated a network of observation wells since 1961, now at 200 wells, up from 189 in 2013. In 2021, of the 121 examined wells, 85 per cent had water levels that were stable or increasing, six had moderate rates of decline, and nine had a large rate of decline. Those last wells are located at Dease Lake and Tumbler Ridge in the north, and the rest are scattered in the lower third of the province.
In 2021, GW levels also dropped in the Columbia Basin, a large area that covers 671,200 square kilometres across B.C. and seven U.S. states. Only 15 per cent of the Basin is in Canada, but this area contributes about 40 per cent of average river flows and about 40 per cent of runoff for the entire Basin, according to an agency called Living Lakes Canada (LLC). It operates the Columbia Basin Groundwater Monitoring Program that involves 22 wells owned by private landowners, local government, First Nations, Selkirk College and the Nature Trust of B.C.
Monitoring in 2021 showed water levels in three aquifers, two in the East Kootenay and one in the West Kootenay, were lower by 0.75 to one metre, compared to the year before.
Alberta
Alberta has been monitoring GW since the 1950s. Each of the 280 wells within the Groundwater Observation Well Network (GOWN) collects data hourly.
“More than 50 of the 280 wells use satellite or cellular-based telemetry to transmit real time GW levels to the GOWN and River Basins websites,” says Dr. John Orwin, director of watershed sciences at Alberta Environment and Parks. “Broad patterns in GW levels show considerable variability in response to climatic conditions across the province.”
Wells showed a clear decline and recovery from the 2002-03 drought, and an increase in GW levels following extreme rainfall in 2013. Levels in response to the 2021 drought vary with depth and location.
Prof. Masaki Hayashi at the University of Calgary is familiar with GW levels in aquifers around that city. He notes they went down during the drought of 2000-2003, 2009-2010 and 2015-2018.
Alberta Environment and Parks has partnered with the Alberta Geological Survey, which has already undertaken mapping of aquifer extent and other factors in areas of the province with higher population density, heavy industrial development (i.e., the Fox Creek and Oil Sands Areas) and others.
“On a broader provincial scale,” says Orwin, “estimates of GW availability on a watershed basis have been developed.”
There is strong water demand for various uses in southern Alberta, and new licences for water withdrawal from surface and aquifer sources are no longer issued. There is some irrigation in the region to ensure high yields of various higher-value crops. In late 2020, the government of Alberta announced a partnership with “irrigation districts” and the Canada Infrastructure Bank to invest $815 million in new irrigation projects (including the relocation of existing canals underground) in the coming years.
Saskatchewan
GW levels have been relatively constant recently, according to the monitoring network of the province’s Water Security Agency. The 70 wells in the network, in remote areas but also in areas with development, collect data on an hourly basis with some equipped with telemetry to obtain real-time readings.
“Historical GW levels from surficial aquifers showed peak elevations due to the flooding events in years 2010-2011,” says Agency spokesperson Sean Osmar. “A delayed response was observed in the aquifers with some wells reaching maximum levels in 2015. From 2015, the GW levels have slowly declined to near normal levels. In 2021, GW levels further declined from 2020 levels in the majority of the monitoring wells in shallow aquifers across Central and Southern Saskatchewan, but levels in the deeper and bedrock aquifer showed relatively minor fluctuations.”
Manitoba
Monitoring the major aquifers in Manitoba has occurred since the mid 1960s. The Ministry of Environment reports that drought in the 1980s affected water levels throughout most of the province for some time, but they recovered during the decade after. Most areas with records from that time show that the lowest levels occurred between 1989 and 1994.
The dry 2021 weather meant little-to-no spring recharge throughout much of the province with declines in all aquifer levels. The most affected aquifers were located in southeastern Manitoba and the Interlake areas, where water levels in the “carbonate aquifer” have been near or at the lowest level recorded. This resulted in pumps having to be lowered and new water supplies developed, especially for livestock producers who normally rely on spring-runoff to fill dugouts.
Ontario
In response to the 1998-99 drought, in 2001 the province established the Provincial Groundwater Monitoring Network (494 wells). The network also involves the Ministry of Environment, Conservation and Parks (MECP), 36 Ontario Conservation Authorities and the Severn Sound Environmental Association. Based on the data, there is no evidence of widespread decline in GW levels. The lowest levels occurred during years 2001, 2002, 2007 and 2012, with 2008 higher than normal.
Over time, equipment has been added to monitor rainfall amounts at 74 sites and soil moisture at 16 of the monitoring sites. In total, 130 wells have been upgraded with satellite tech to transmit hourly water level, rain and soil moisture data. In addition, over the last decade, the MECP has established a collaborative network of seven “Integrated Climate Change” stations across the province, monitored for weather and level and quality of water in streams and GW.
Nova Scotia
The observation well network in Nova Scotia has been running since 1965, with 40 wells of which many are within one kilometre of the coast. Of these, nine have real-time monitoring.
In 2016, southwest Nova Scotia experienced the most severe drought since 1880, but some areas also experienced unusually low GW levels again in 2018 and 2020. Overall, over the past decade, half the wells show no statistically definable trends, with variations in water levels ranging from minus 3 to plus 4 centimetres per year.
“This shows a lot of variability across the province in average annual water levels,” says Tracy Barron of Media Relations at Nova Scotia Environment and Climate Change. “Most wells were included to represent and monitor natural/ambient conditions and not man-made changes, however, variances could be explained by local phenomena, increasing water demand from development, lessened GW withdrawals or greater recharge conditions.”
The province also has a community-based water level monitoring network that focuses on 10 shallow-dug well aquifers. There is not enough information available for analysis yet, but anyone can view real time water levels.
New Brunswick
Levels here were monitored from the early 1970s to 1993 using a Stevens F-type recorder coupled with manual observations, but the network was disbanded in 1993. A few years after, nine GW monitoring stations were established, maintained by the federal government in partnership with the province. Data has been consistently collected from 2005 onward for all stations. Levels over the last five years vary significantly, but many stations had their lowest levels in the fall of 2020 due to low precipitation that summer.
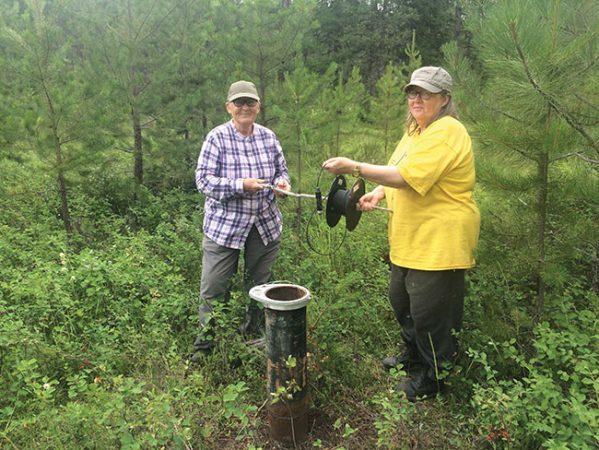
Groundwater levels are monitored in every province (the Northwest Territories and the Yukon monitor surface water levels). Some observation wells are monitored hourly and some are equipped with real-time measurement technology.
Photo credit: Living Lakes Canada.
Prince Edward Island
There are 15 monitoring wells in P.E.I, many of which have been monitored for several decades.
For decades, GW levels have been flat, but over the last decade, trending slightly higher. Specifically during the last few years, levels have fluctuated widely and setting new historic highs and lows; in 2021, GW level reached a historic high in the spring.
“There is evidence of a shift in seasonality,” reports the provincial environment ministry. “For example, GW levels largely increase from December to March, and largely decreases during May in the last several decades and more obviously in recent years. The reasons are earlier snow melt and precipitation pattern changes.”
Newfoundland and Labrador
Real-time monitoring of GW levels and other parameters is conducted at some wells on industrial sites that are not specifically part of an observation well network.
Northwest Territory
Surface water levels here are monitored in 14 rivers and Great Slave Lake. Mike Westwick, spokesperson for the Department of Environment and Natural Resources, says these levels have been extremely variable over the past few years and are dependent on precipitation. For example, Great Slave Lake levels were the lowest in the 80-year record during summer 2015, and highest during summer 2020.
Yukon
Overall surface water levels were above average in 2021 and exceeded historical records in some cases, largely driven by well above-average snow packs in some basins. Snowpack and precipitation drive peak water levels, and the territory has experienced both extreme minimum and maximum levels in the last five years.
Climate change impact
Westwick notes that climate change can impact water levels in the Northwest Territories, not just by affecting precipitation (more extreme rainfall events or drought, higher proportion of precipitation falling as rain instead of snow), but by the timing of snowmelt, and by changing the physical structure of the ground surface through permafrost thaw. He explains that, for example, large thaw slumps can increase the sediment load to northern rivers or change the way water moves through the ground. Scientists in the N.W.T. are measuring and documenting hydrological processes to better understand how our natural systems are changing.
In the Yukon, an increase in annual minimum surface water flows have been observed across the territory, with the largest positive trends in the continuous permafrost zone. This, says the Ministry of the Environment, is likely the result of increased groundwater storage and discharge due to permafrost degradation and increased active layer depth.
The P.E.I. Ministry of the Environment notes that climate change is affecting and will continue to affect GW in coastal communities with an increase in saltwater intrusion due to sea level rise, and also across the province with changes in the recharge rates of GW.
“For example, increases in storm events lead to more run-off and less recharge to the groundwater table. As another example, less snow leads to less spring melt and decreases in recharge to the groundwater table.”
Sea level rise aside, Barron in Nova Scotia notes that saltwater intrusion can be potentially affected by tidal ranges, geology, topography, geomorphology and location of wells. That province has developed a map that can help to evaluate risk at the local level.
Regarding the Prairies, Dr. James Byrne, a geography professor at the University of Lethbridge who has studied water and climate change for about 40 years, believes that climate change effects are likely to show up as periods of prolonged drought.
“GW levels will undergo increasing stress in the southern Prairies and this region will be dryer overall,” he says. “However, parts of Canada including the Prairies may see other weather extremes such as bouts of extreme precipitation,” such as what occurred in fall 2021 in British Columbia.
Community monitoring
In 2018, Living Lakes Canada in B.C. and two other groups convened a roundtable for recommending how the federal government can support and engage in community-based water monitoring (CBWM). There were more than 50 participants, including Indigenous and non-Indigenous CBWM practitioners and scientists. CBWM is described by LLC as “a powerful means of achieving shared water management and sustainability objectives,” but adds that “to realize the full potential of this growing movement, coordination and leadership is needed at the federal level, across departments and in concert with non-governmental actors.”
LLC executive director Kat Hartwig explains that out of the 60 recommendations created, in 2021, the CBWM coalition outlined a handful of key actions for the federal Ministry of Environment and Climate Change.
“These actions focus,” she says, “on identifying regional CBWM leaders that can scale proven programs to establish cohesive regional monitoring initiatives, ensuring all water data is shared on open access platforms, and broadening and expanding federal funding for CBWM activities.”
LLC is already acting on these recommendations through the Columbia Basin Water Monitoring Collaborative, which it’s facilitating to establish a unified monitoring network in the Upper Columbia Basin. The Collaborative is based on a water balance approach guided by local priorities, as well as through the affiliated “Columbia Basin Water Hub” open-access database that launched in March 2021. (Data from the LLC Groundwater Monitoring Program is already housed in the Hub.)
As it is with many environmental parameters, funding for long-term GW monitoring is patchy across the country – and in the view of LLC, unstable and insufficient. LLC Groundwater program manager Carol Luttmer notes that in addition to provincial programs, there are several excellent community-based programs already running in various provinces, collecting GW level data similar to the Columbia Basin program. These local programs provide a cost-effective way to collect data that otherwise would not be collected.
“We are sharing ideas and information,” she says. “However, these programs really need long-term sustained funding. The development of a network of networks would help share best practices and allow for expansion in data-deficient areas. With the impacts of climate change it’s critical that we have site specific data for different aquifers so GW can be effectively protected and managed to meet the needs of people and nature at the aquifer scale.”
Treena Hein is based in Ontario.
Print this page